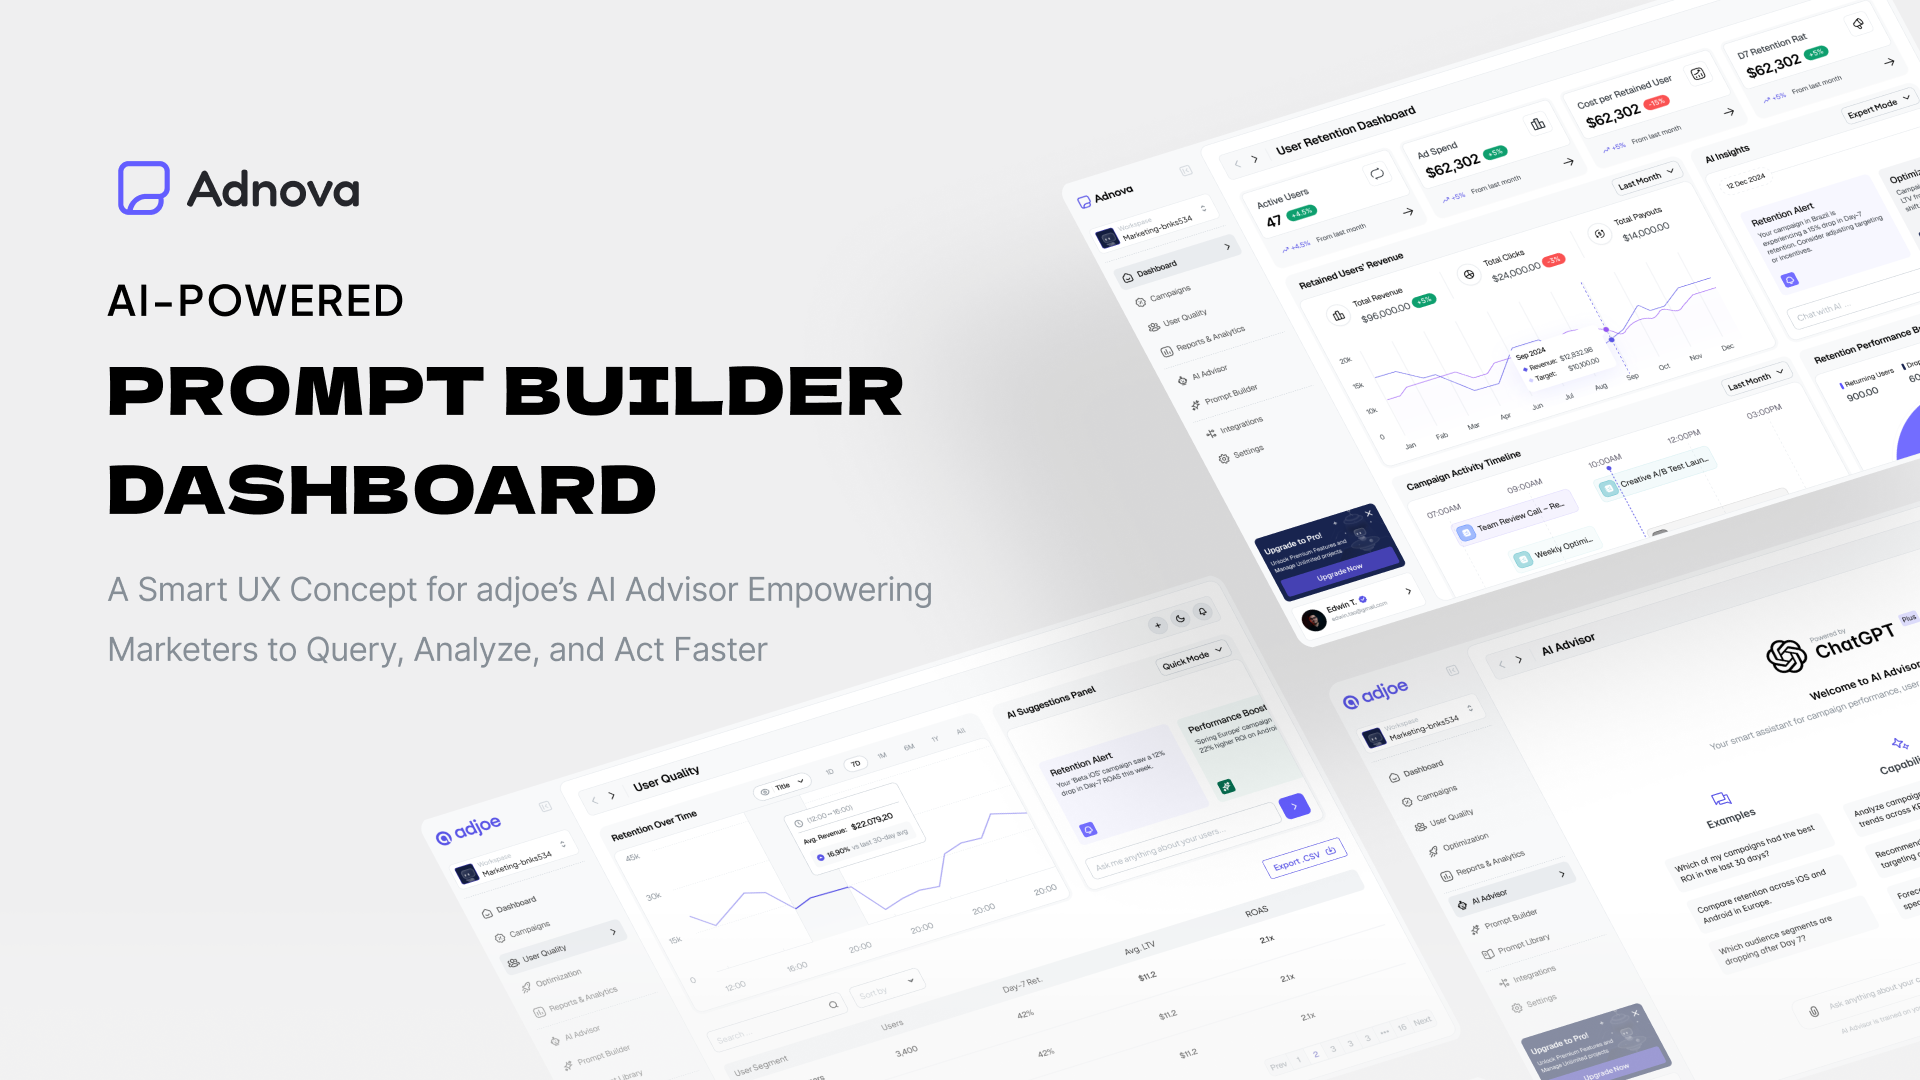
Adnova
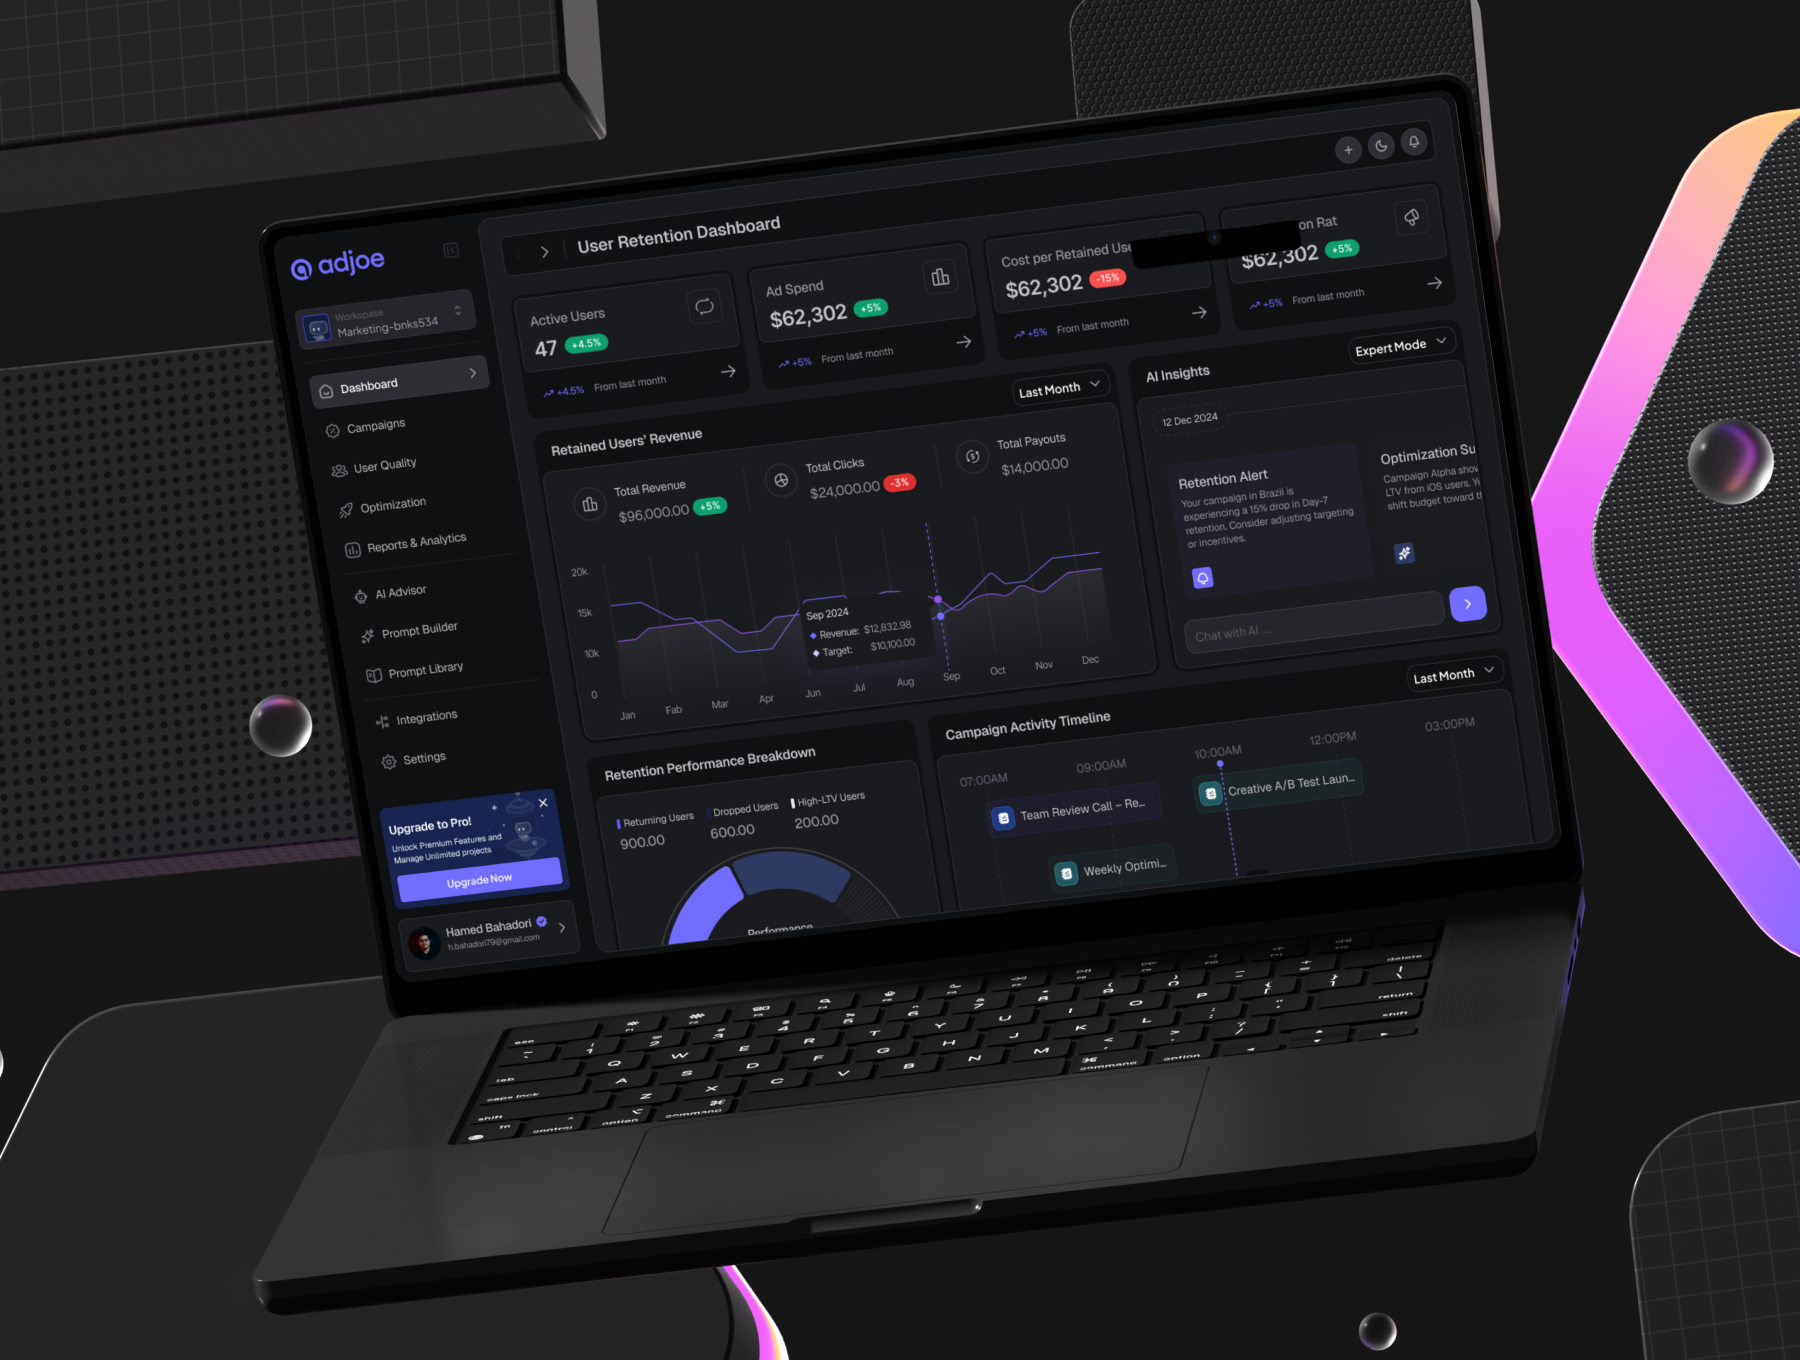
Adnova is an AI-driven marketing dashboard for performance teams. The brief was straightforward to write and hard to design: turn fragmented campaign data into decisions, without burying the user in charts or hiding the data behind a chat box.
| Year | 2025 |
| Role | Product Designer |
| Focus | AI UX, dashboards, design system |
| Website | hamedbahadori.com |
The real question
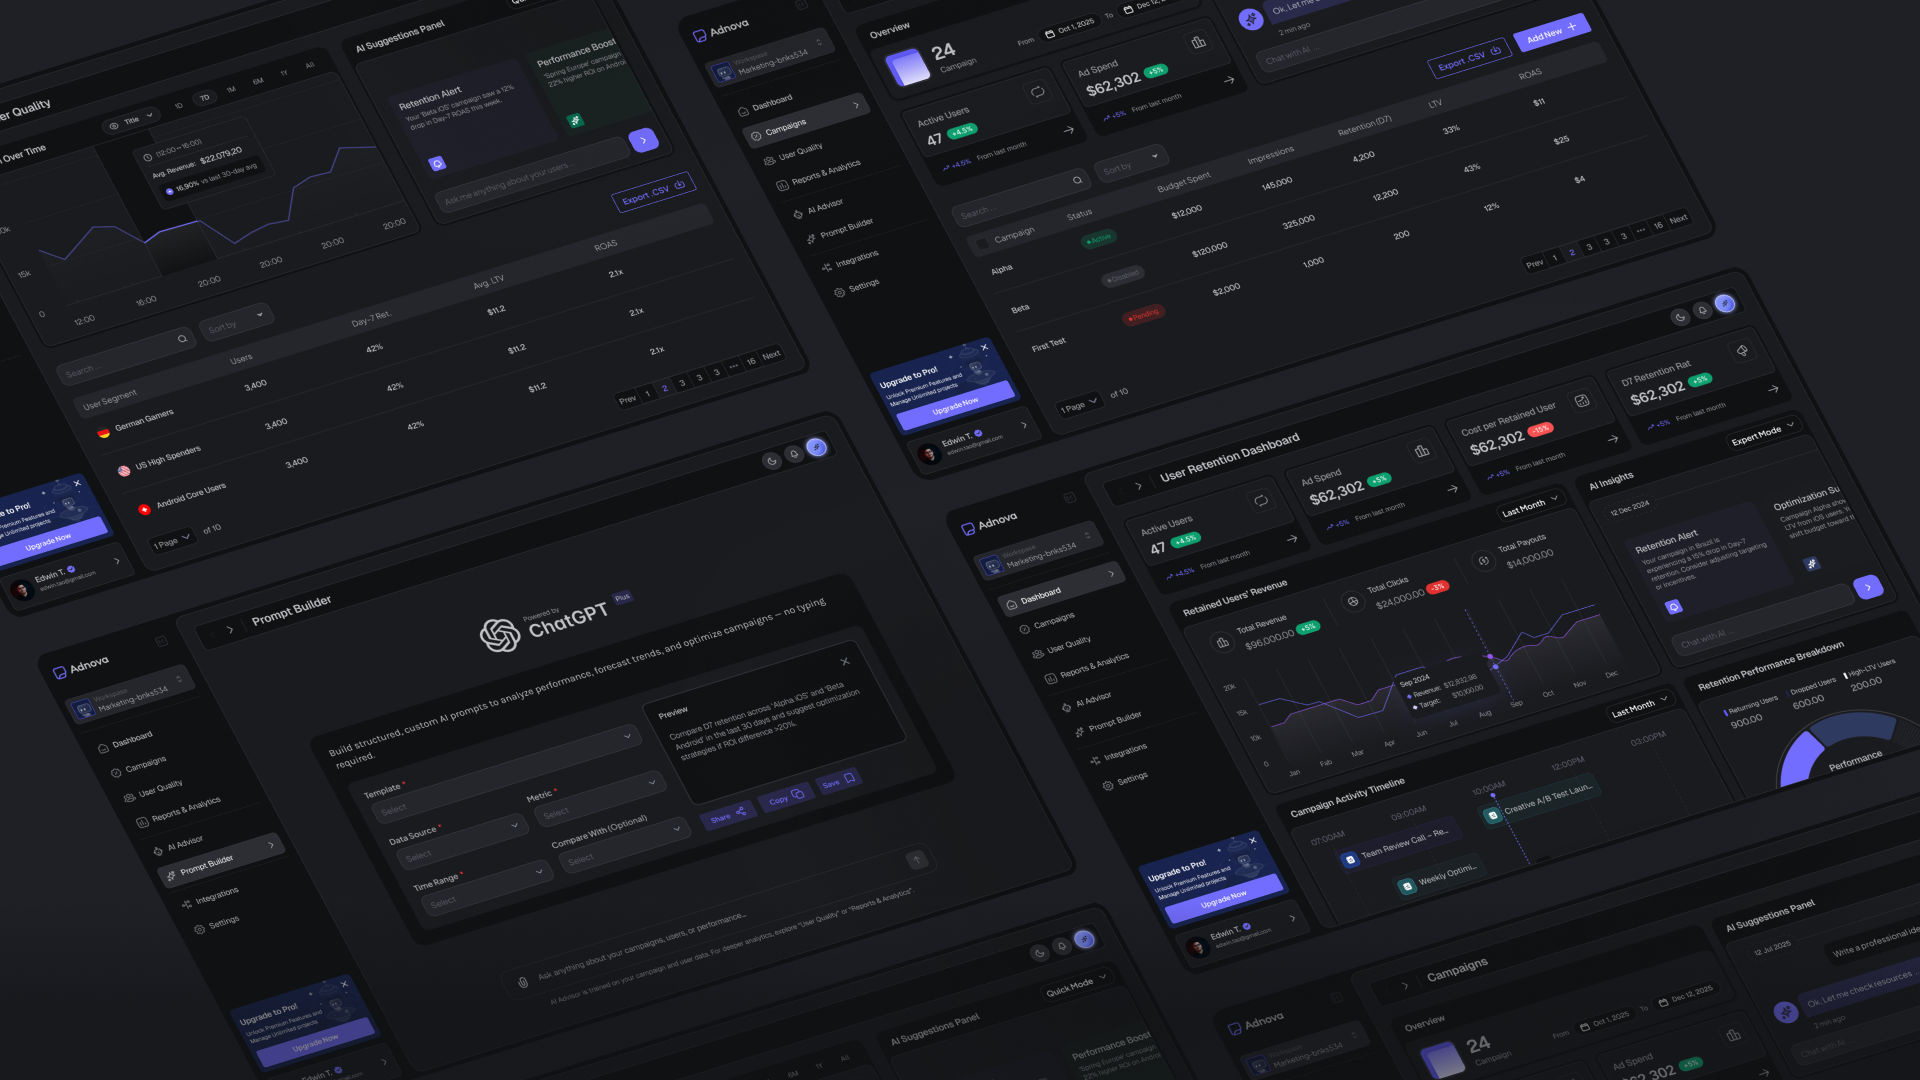
Marketing dashboards usually fail in one of two ways. They either dump every metric on a single screen and force the user to make sense of it, or they wrap everything in an AI chat and hide the data behind a prompt. Neither works for a marketer who needs to ship an answer before the next standup.
Five decisions that shaped the dashboard
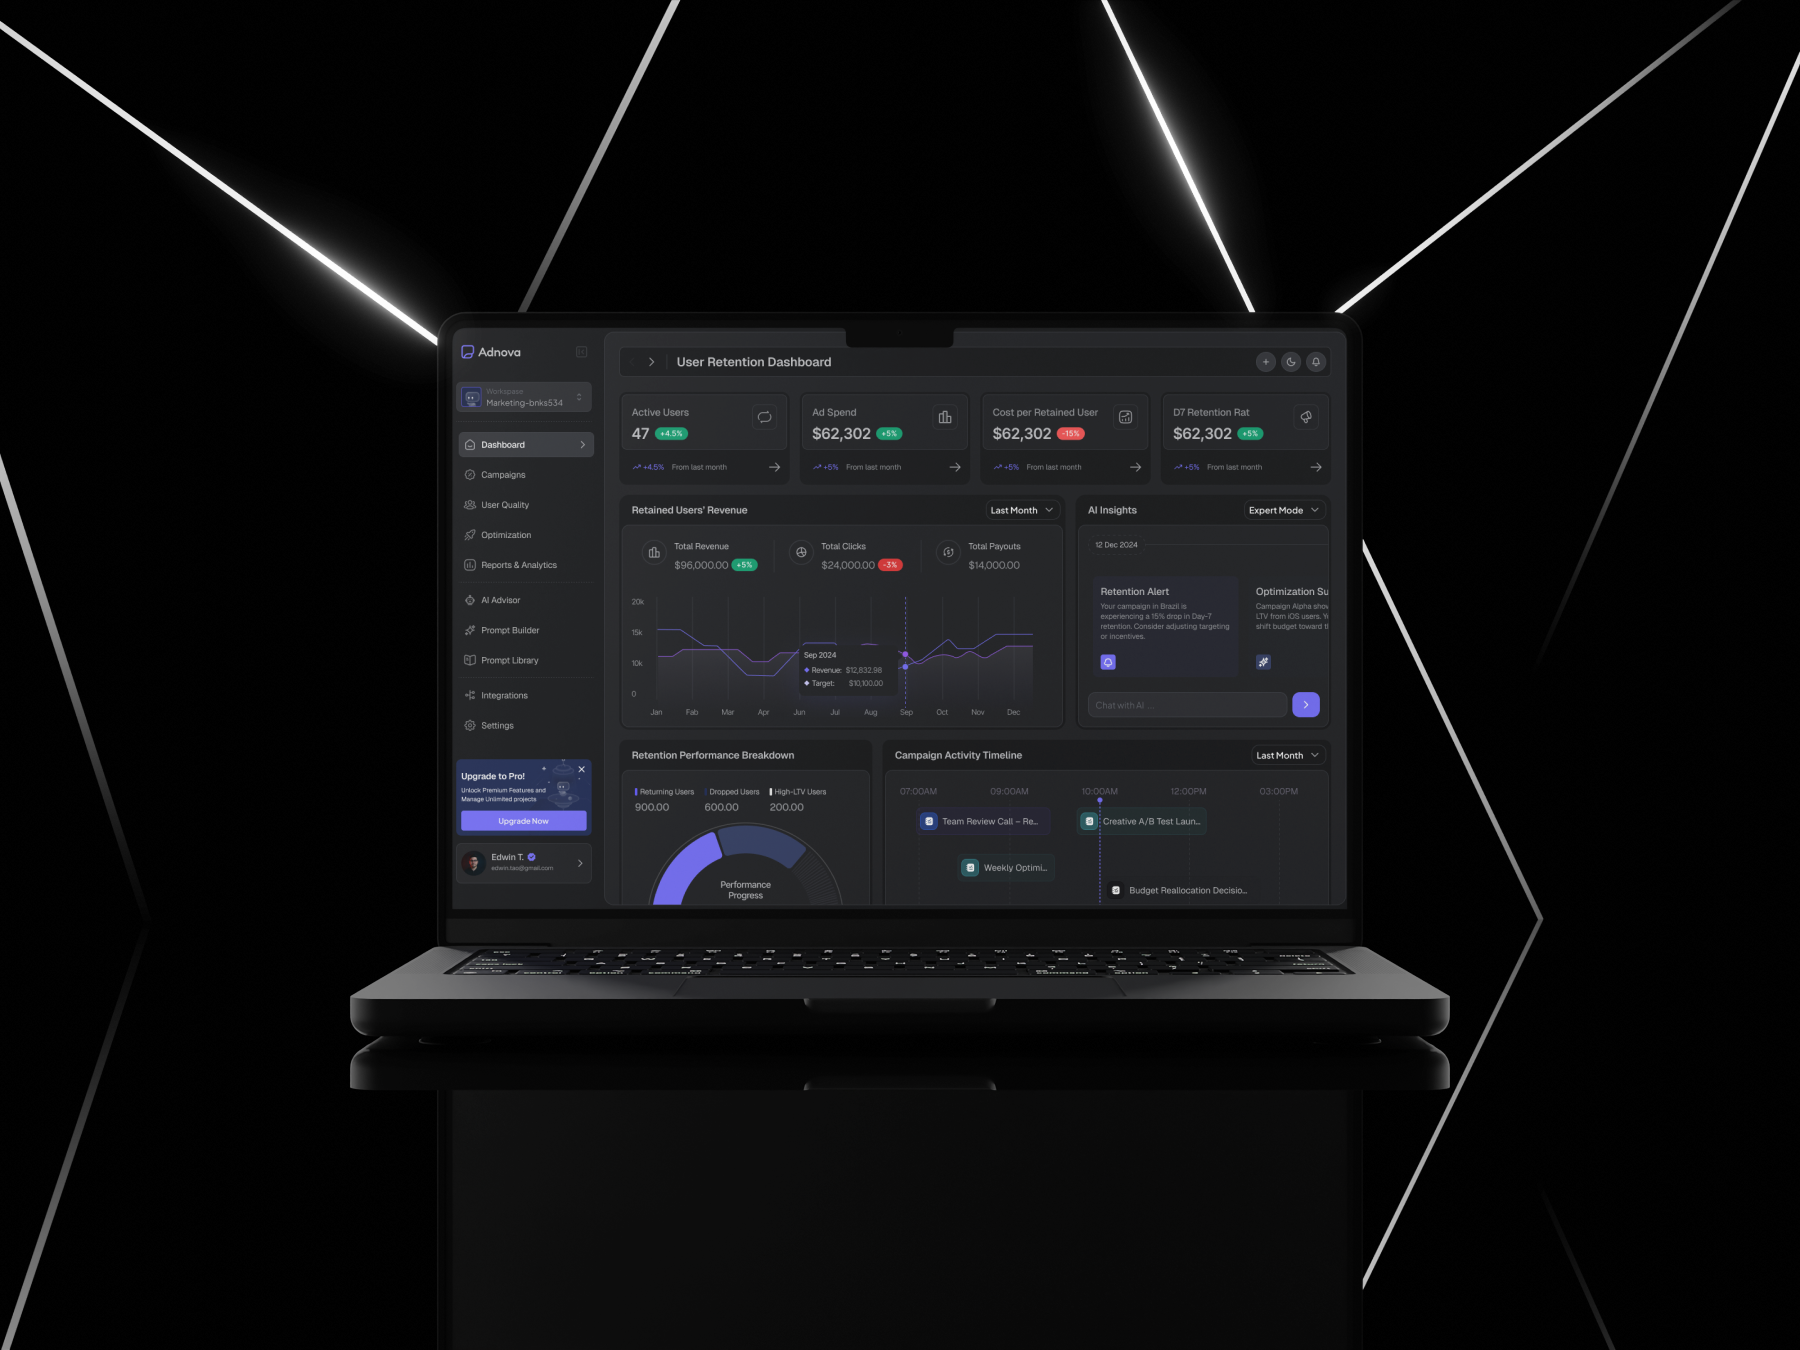
Insights above charts
AI alerts and trend summaries land first; raw data sits one click below — visible, not hidden.
Traceable AI suggestions
Every AI tip cites the campaign, metric, and timeframe it came from. No black-box advice.
Prompt Builder, not a prompt box
Source, metric, and timeframe pickers compose the prompt — no blank-page tax on the user.
Embedded AI Advisor
Chat lives next to the campaign it discusses, not in a separate tab.
Variant-driven design system
Atomic components, light + dark themes, AA contrast. Same primitives across every module.
Decision-led, not chart-led
The dashboard answers "what should I do next?" before it answers "what happened?"
Trade-offs I made on purpose
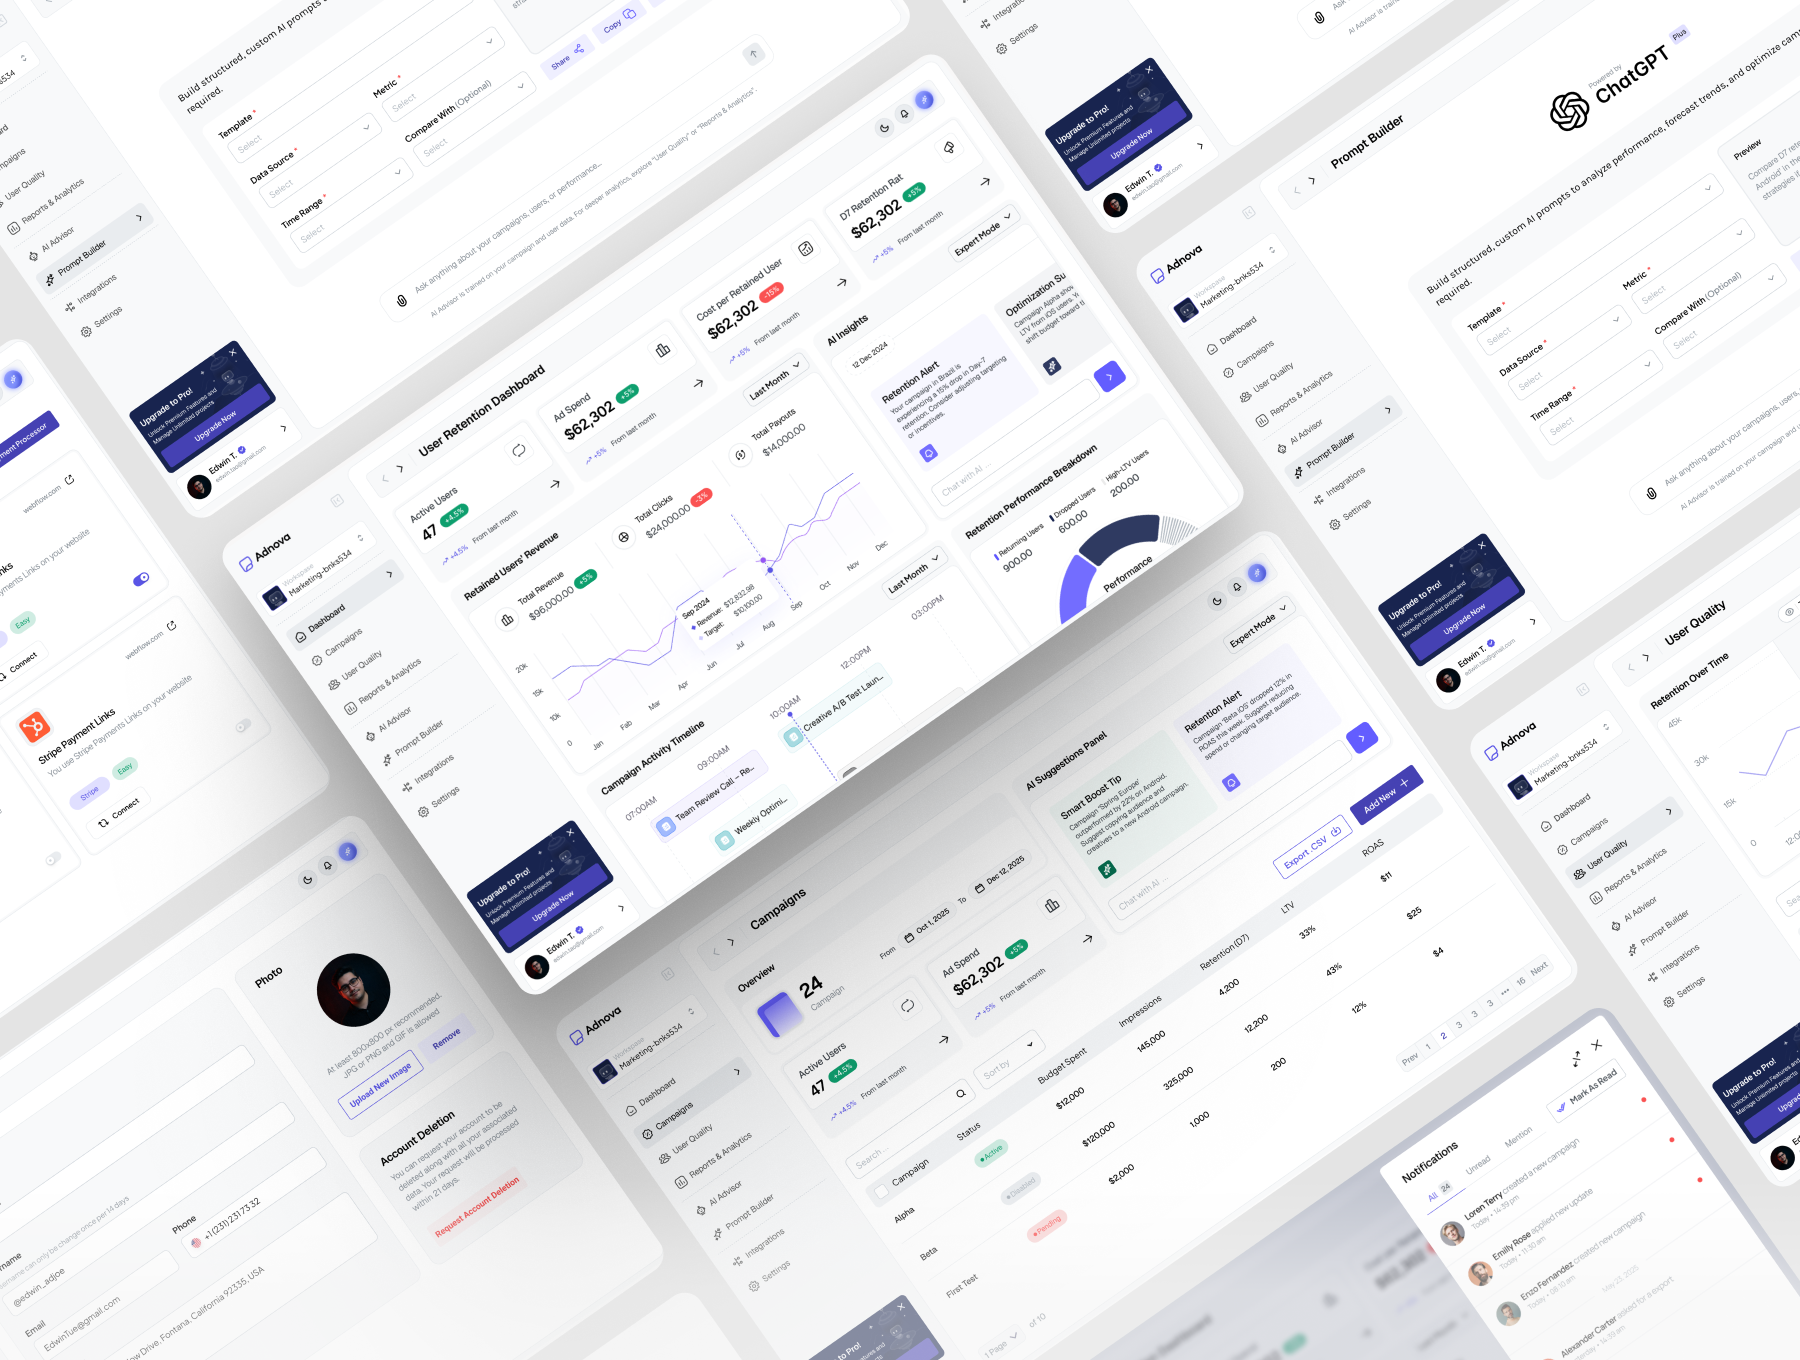
What the dashboard covers
Dashboard
KPI overview, AI alerts, user behavior graphs.
Campaigns
Budget, retention, ROAS, contextual smart tips and warnings.
User Quality
Segment-level insights and retention performance.
Prompt Builder
Compose GPT analyses from source / metric / timeframe pickers.
AI Advisor
Chat-based strategic suggestions, embedded next to the campaign.
Settings & Profile
Account, integrations, theme, accessibility.
Design system
Reusable cards, data tables, toggle tabs, alert banners, modals. Light and dark themes are powered by Figma variables, so the team can swap themes without rebuilding components. Microinteractions — hover states, collapsible charts, tooltips, loading feedback — exist where they aid comprehension, not as decoration.
Impact
Lower cognitive load
Marketers see the answer first, the data second.
AI with receipts
Suggestions cite their source — confidence goes up.
Reusable SaaS kit
The component set ports cleanly to fintech, analytics, ops dashboards.
Learnings
- 01Variant-based systems future-proof multi-theme products. Theme is a property, not a redesign.
- 02AI + UX only works when the model shows its work. Context and traceability earn the trust.
- 03Figma discipline pays off at handoff. Clear naming and tokenization save the next person's week.